Improving the Ad Delivery Reporting Efficiency
Conducting research in challenging conditions
This case study illustrates my ability to deliver research under challenging project conditions. For this study, the key challenges included:
- A lack of purpose-built UXR tools or platforms
- A design team and product manager located abroad, with a large timezone difference that created communication barriers
This study was conducted at Samsung Ads, a leading provider of advanced TV advertising solutions. This study focused on an internal dashboard tool used by Samsung Ads employees to generate and download advertisement delivery reports for clients. I conducted a moderated usability study to evaluate the redesign of the internal dashboard tool with the goal of improving the user experience and efficiency of the tool. This study is part of a larger project to improve the Samsung Demand Side Platform (DSP).
Research methodology: Moderated Usability Study
Research tools: Figma, General purpose business tools (e.g., Microsoft Office Suite)
Audience: Internal Samsung Ads employees
Role
As the lead researcher, I directly collaborated with Design, Product, and Research in the initial planning phase of the study. We met to discuss the design and flow of the prototype. Throughout the study, I worked closely with design and product to make sure this study was meeting key business goals.
I completed this study independently under supervision of my manager (UX Design and Research manager) and with support on analysis and note taking from others on the research team (Senior Researcher, Apprentice Researcher). I took ownership of the overall study and decisions. This included the participant recruitment, development of the usability test script, and led the data analysis.
Project Background
Delivery reports in the Samsung Ads Demand-Side Platform (DSP) are an important tool used by internal operations employees to check on pacing, spend, delivery performance video completion rate, clickthrough rate, and revenue.
Samsung Ads employees who use the delivery report on a regular basis:
- Campaign Managers: Setup, configure, manage, monitor, and optimize campaigns for clients.
- Supply Performance Managers: Managing the ad supply.
- Business Intelligence Managers: Navigating new processes for internal Samsung Ads employees.
- Client Solutions Managers: Providing end-to-end campaign support for clients.
Self-serve users, who are not Samsung Ads emplyees, also use this tool to generate and downloade delivery reports.
Interactive Delivery Report
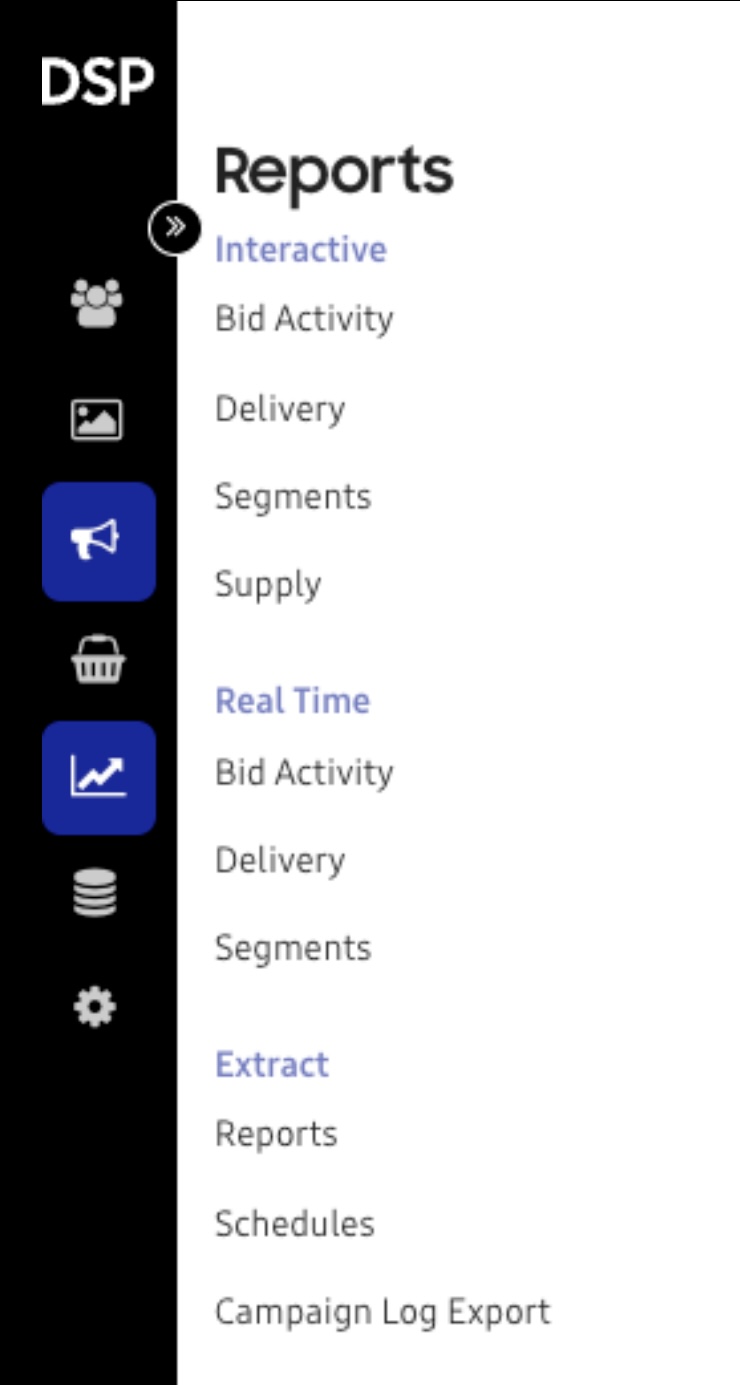
The current delivery report is split into two types: Interactive and Extract.
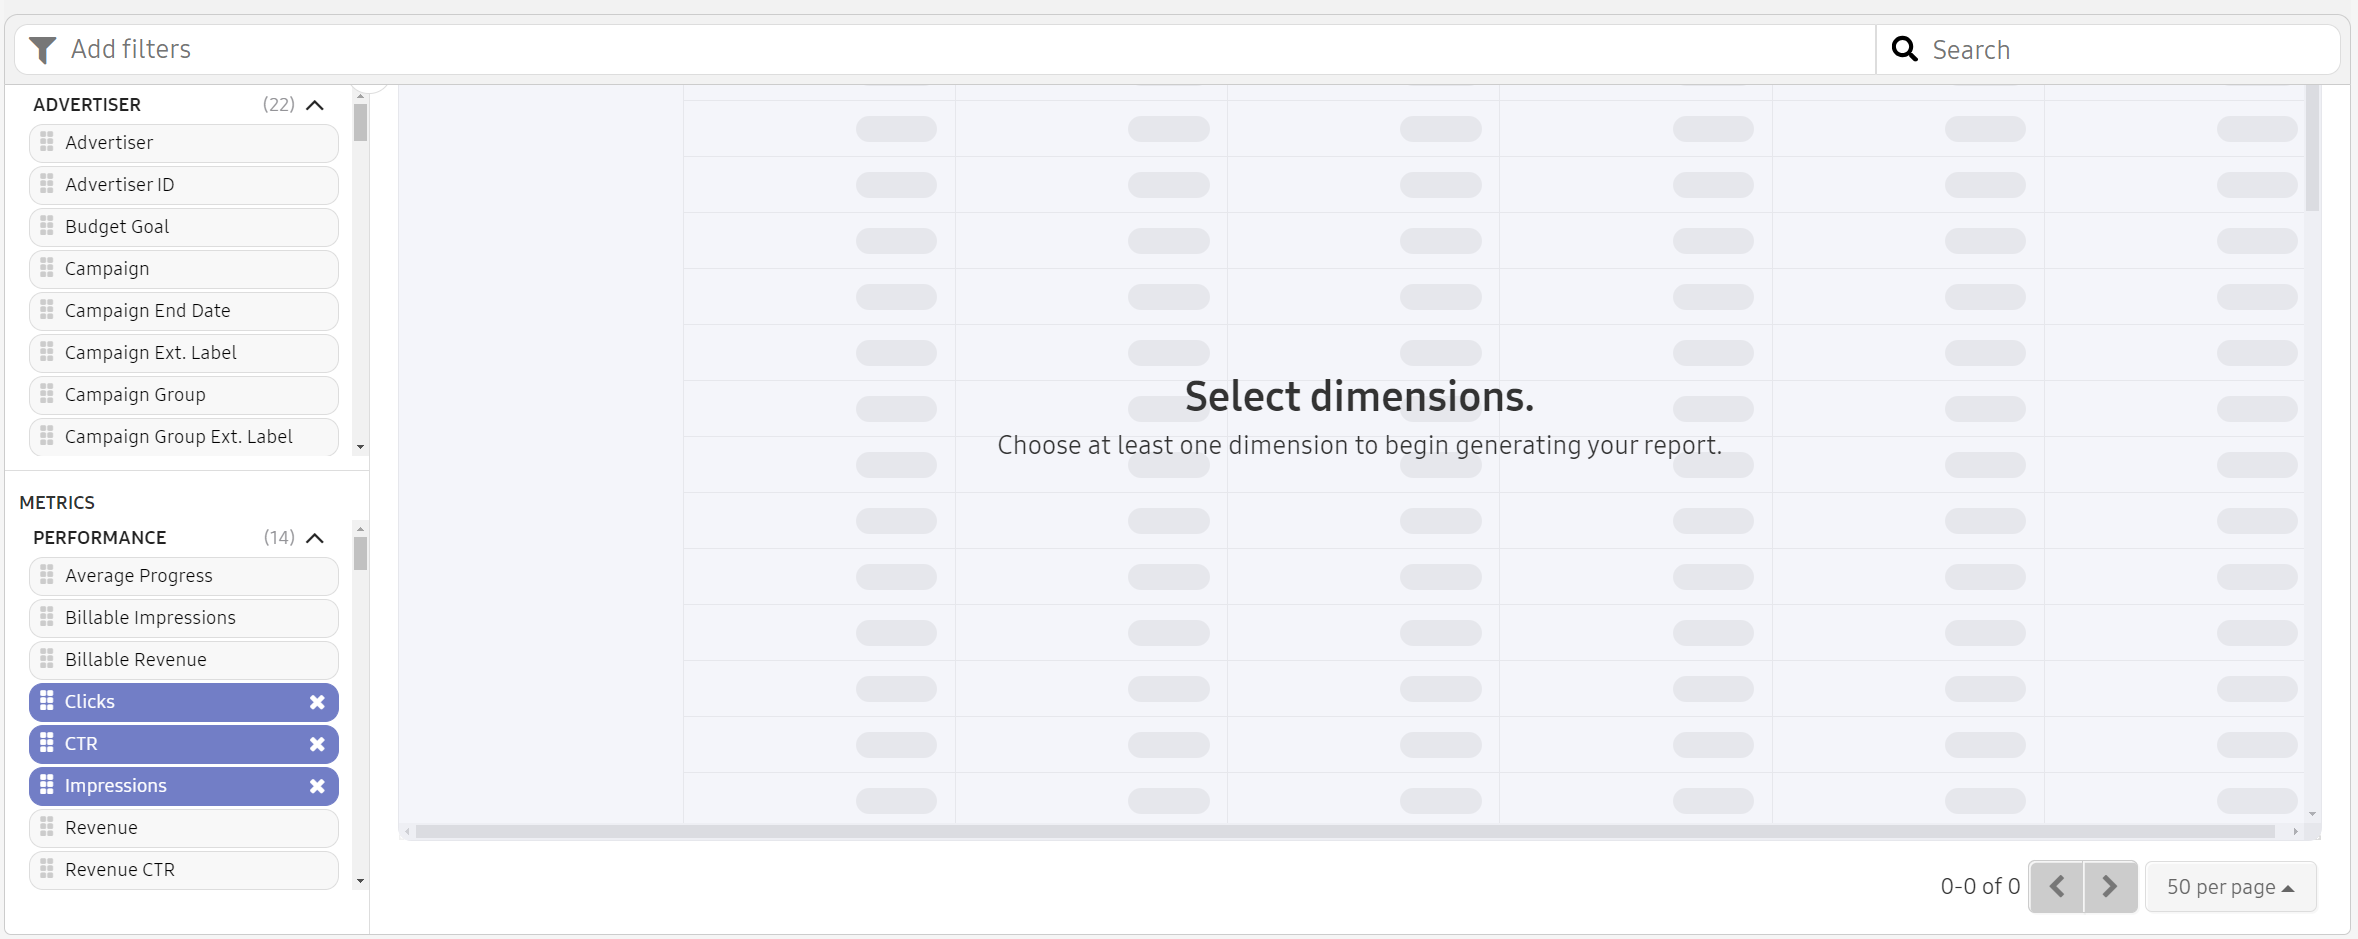
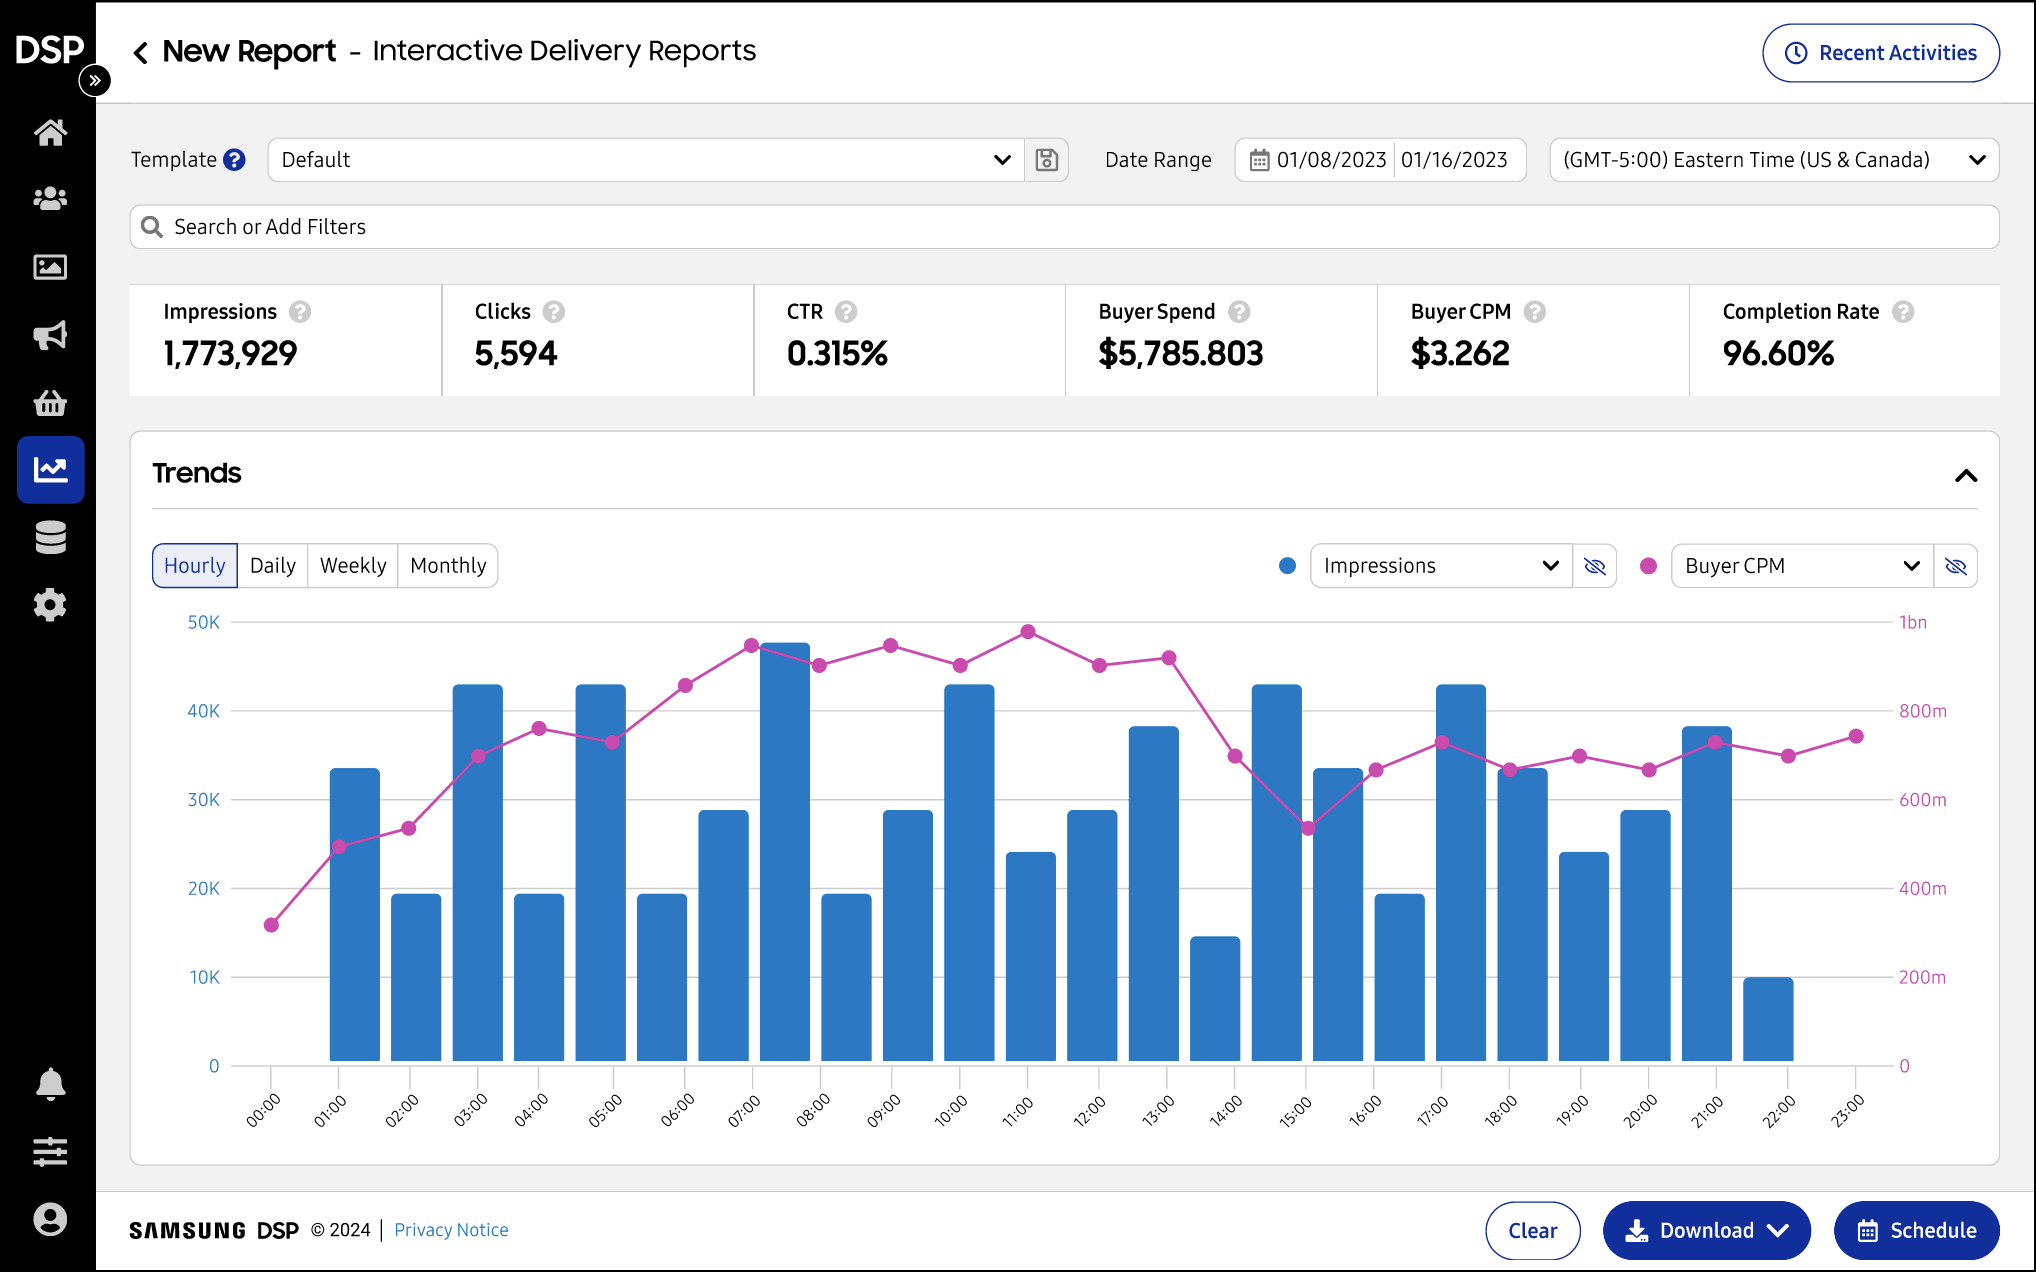
The interactive report contains a preview of delivery data and can be fully customized. The report is interactive and allows users to filter and drill down into the data. It contains four main sections:
Templates & Filters

Key Metrics

2D Trends Chart
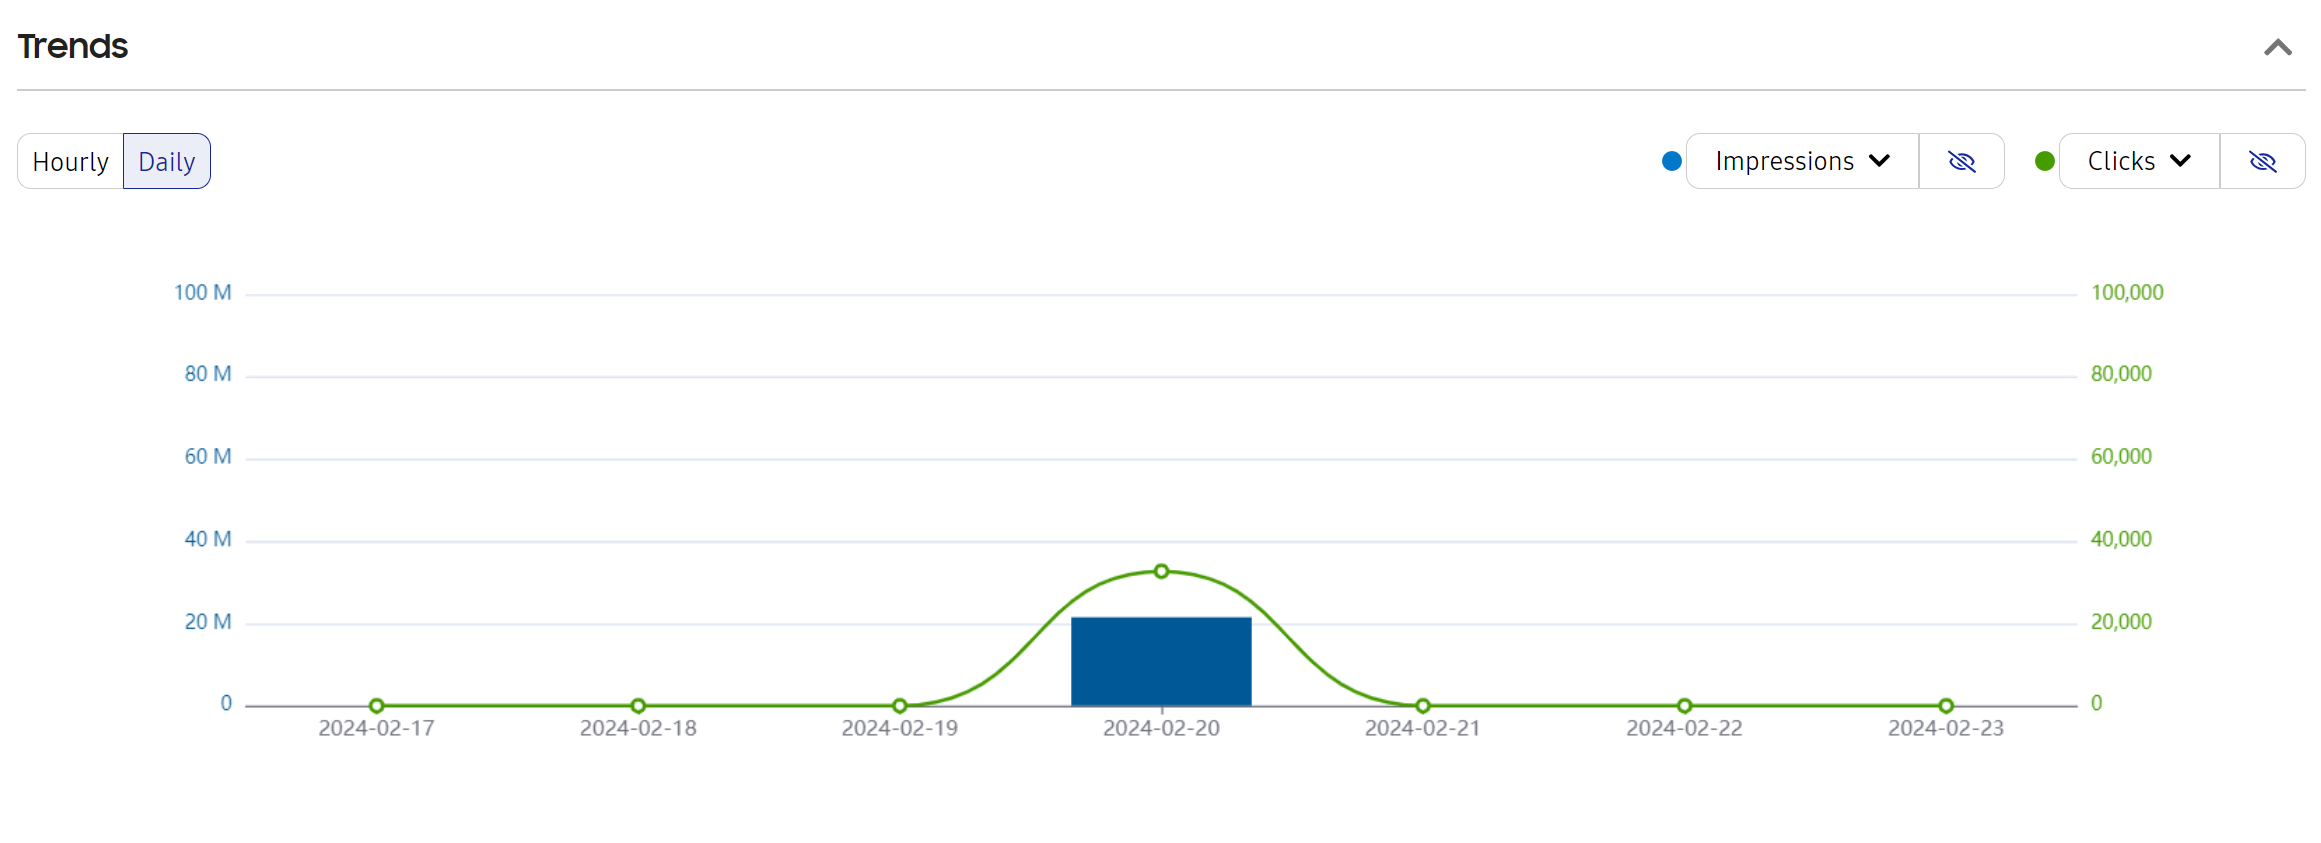
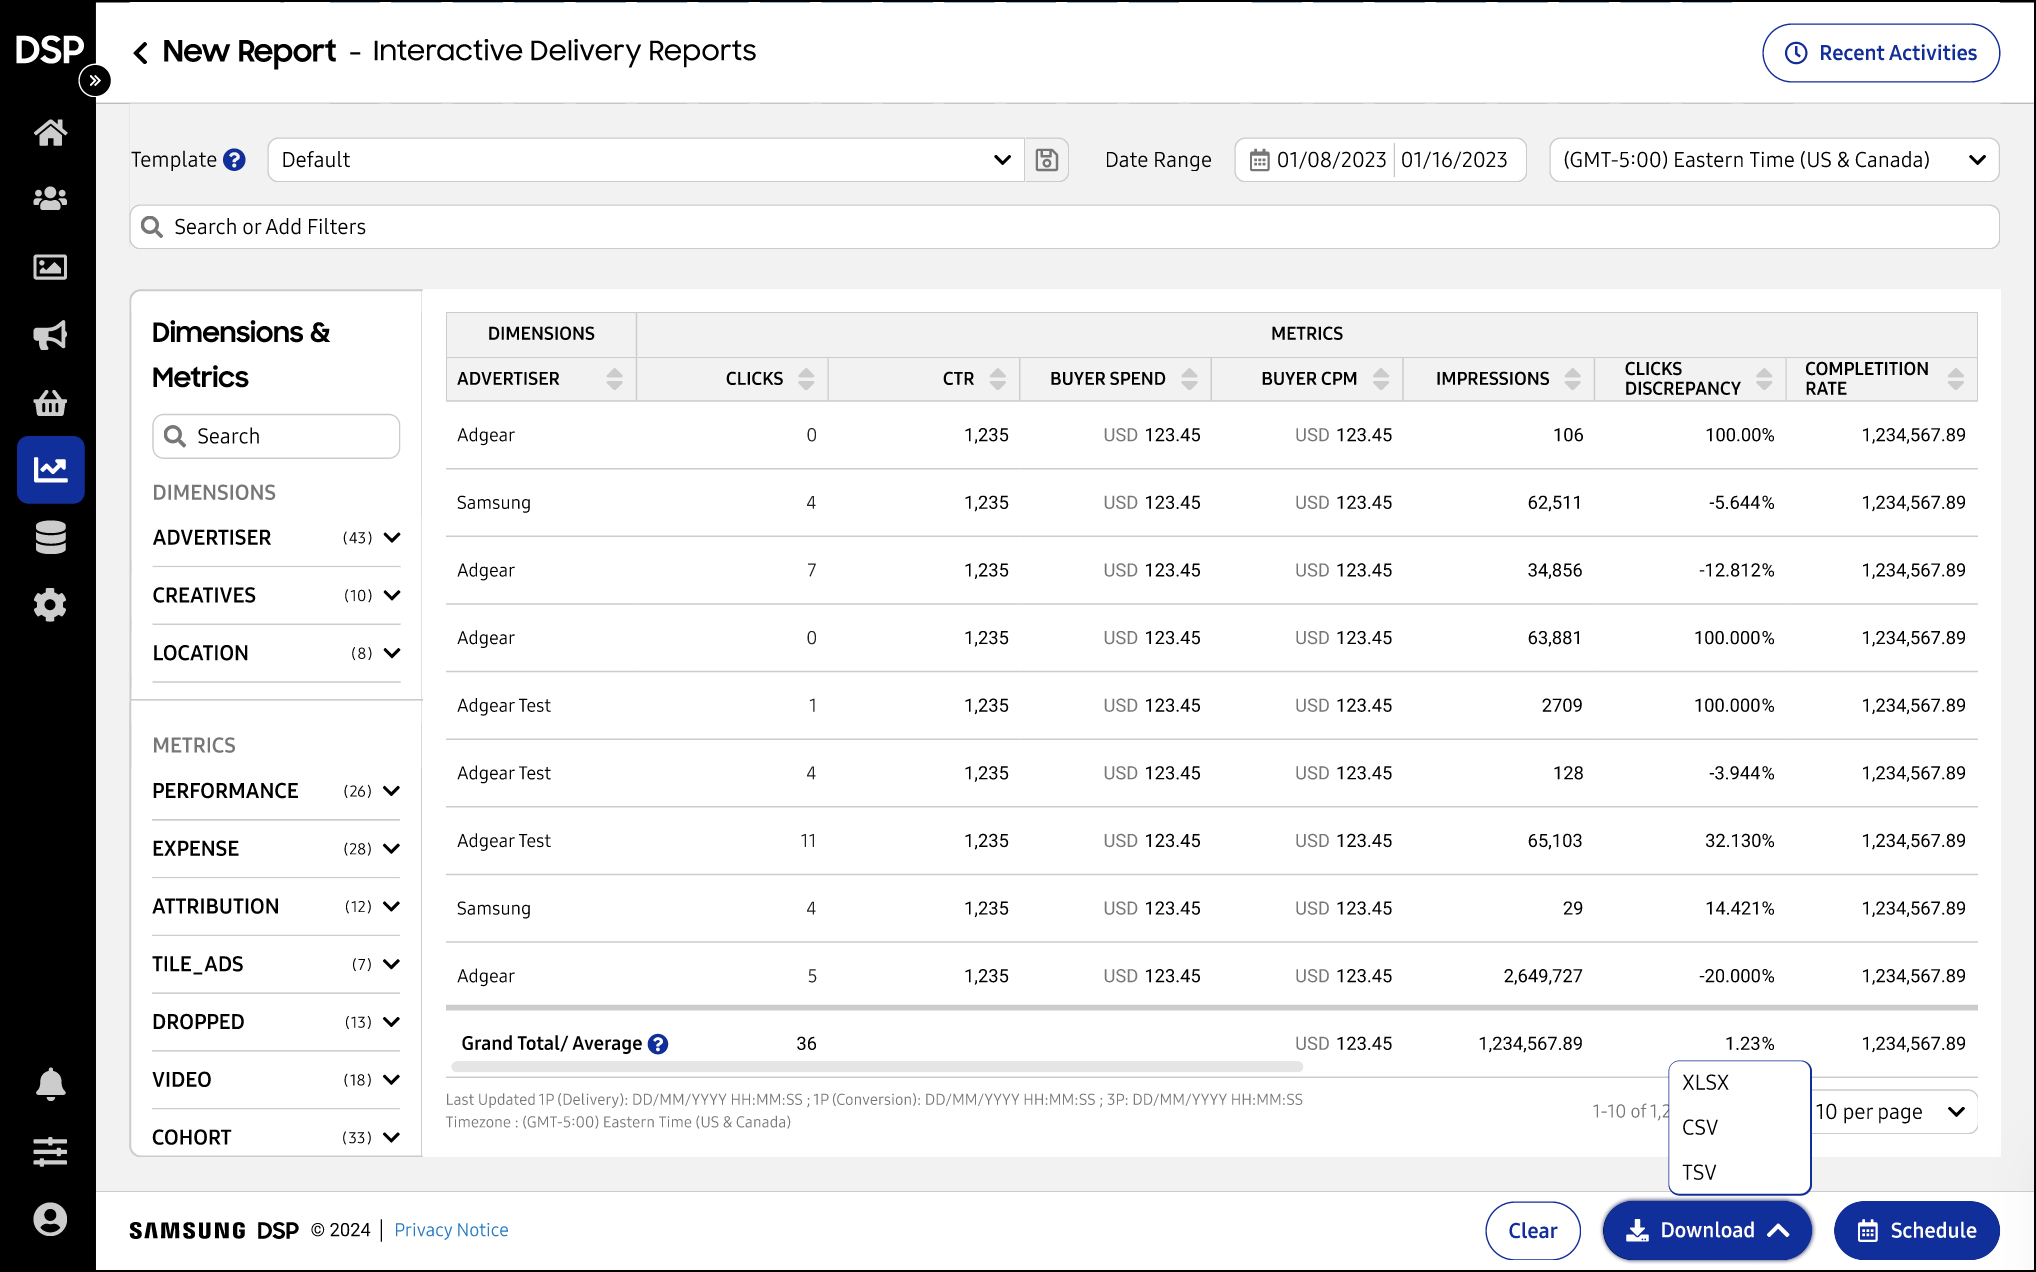
Dimensions & Metrics
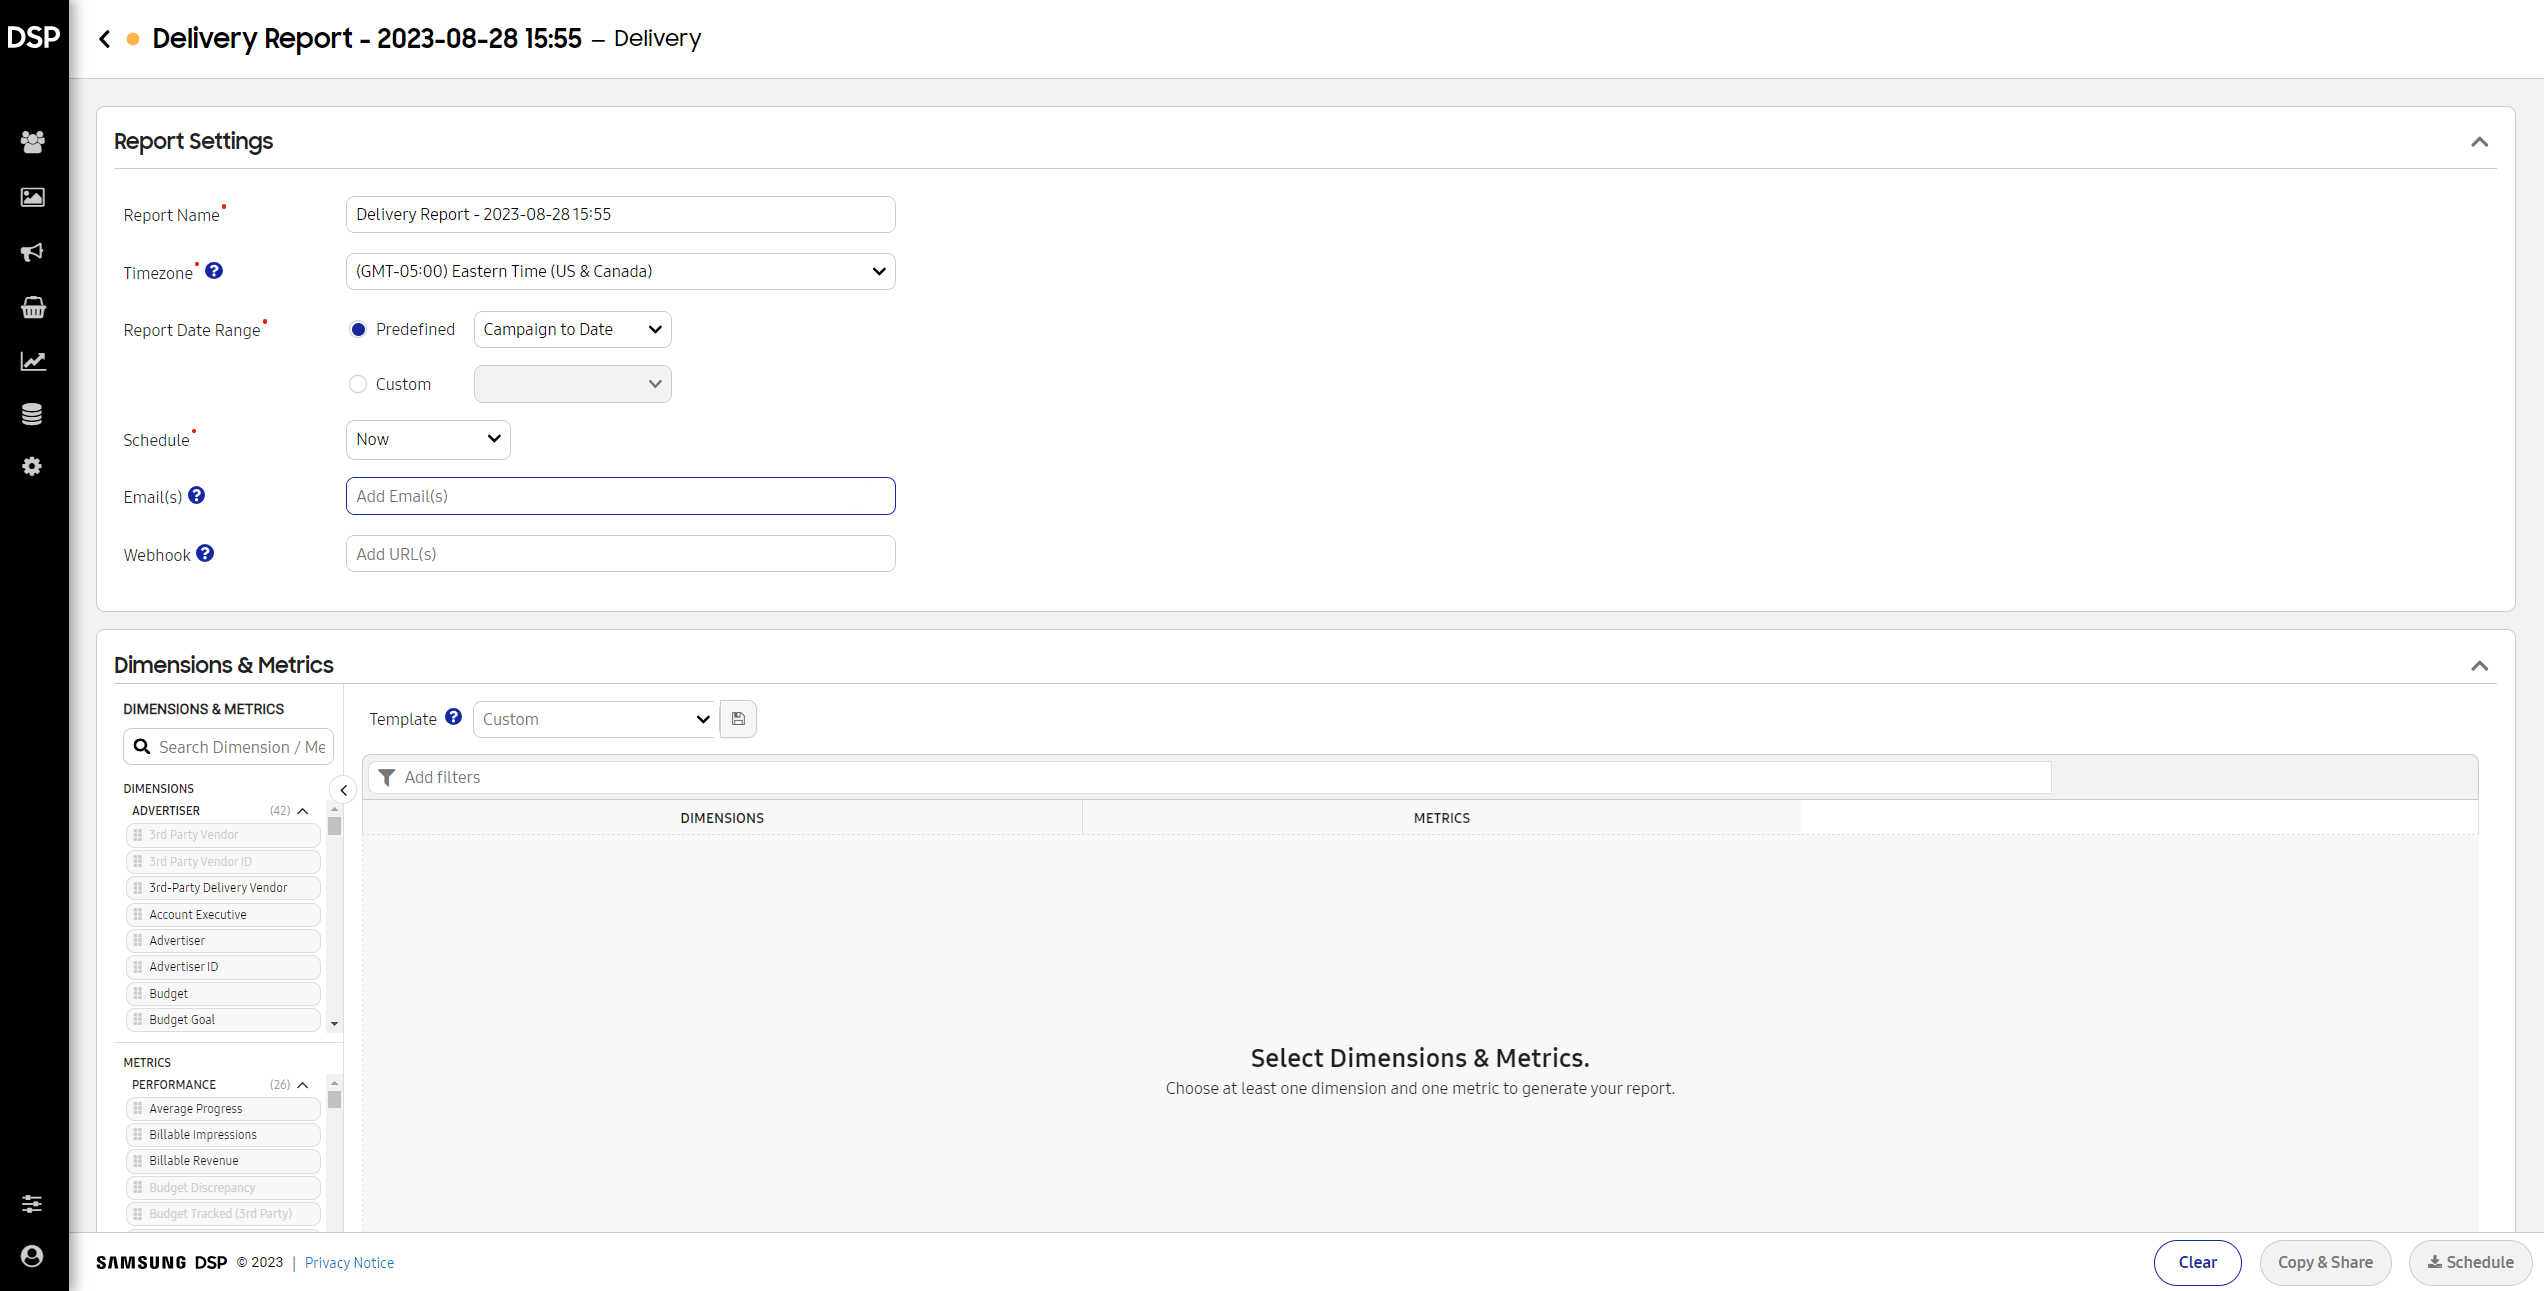
Extract Report
The extract report is cusomizable and allows users to either immediately download a report, or schedule it for a future date and time. There is no data preview in this report.
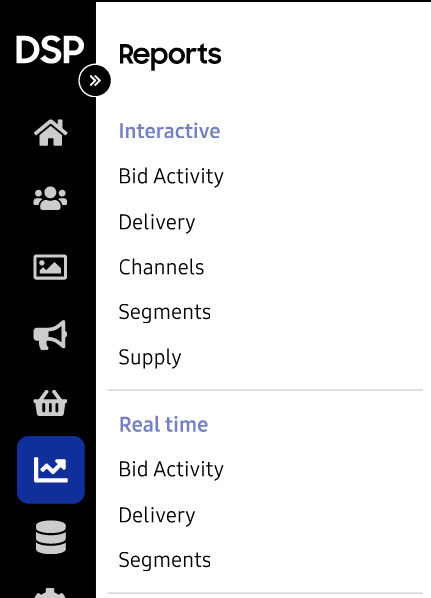
Navigation to the reports
The Extract and Interactive reports can both be found under the Reporting & Insights section of the left navigation menu.
The redesign of the interactive delivery report aimed to integrate the features of the extract report. The goal was to create a smoother and more efficient user experience by merging the two reports into one. This would allow users to generate, schedule, and download delivery reports in a single location. The changes were designed to streamline the user experience and make it easier for users to access and manage their reports.
Design Changes
Removing the Extract sub-section from the Reporting & Insights sub-section in the lefthand navigation bar.
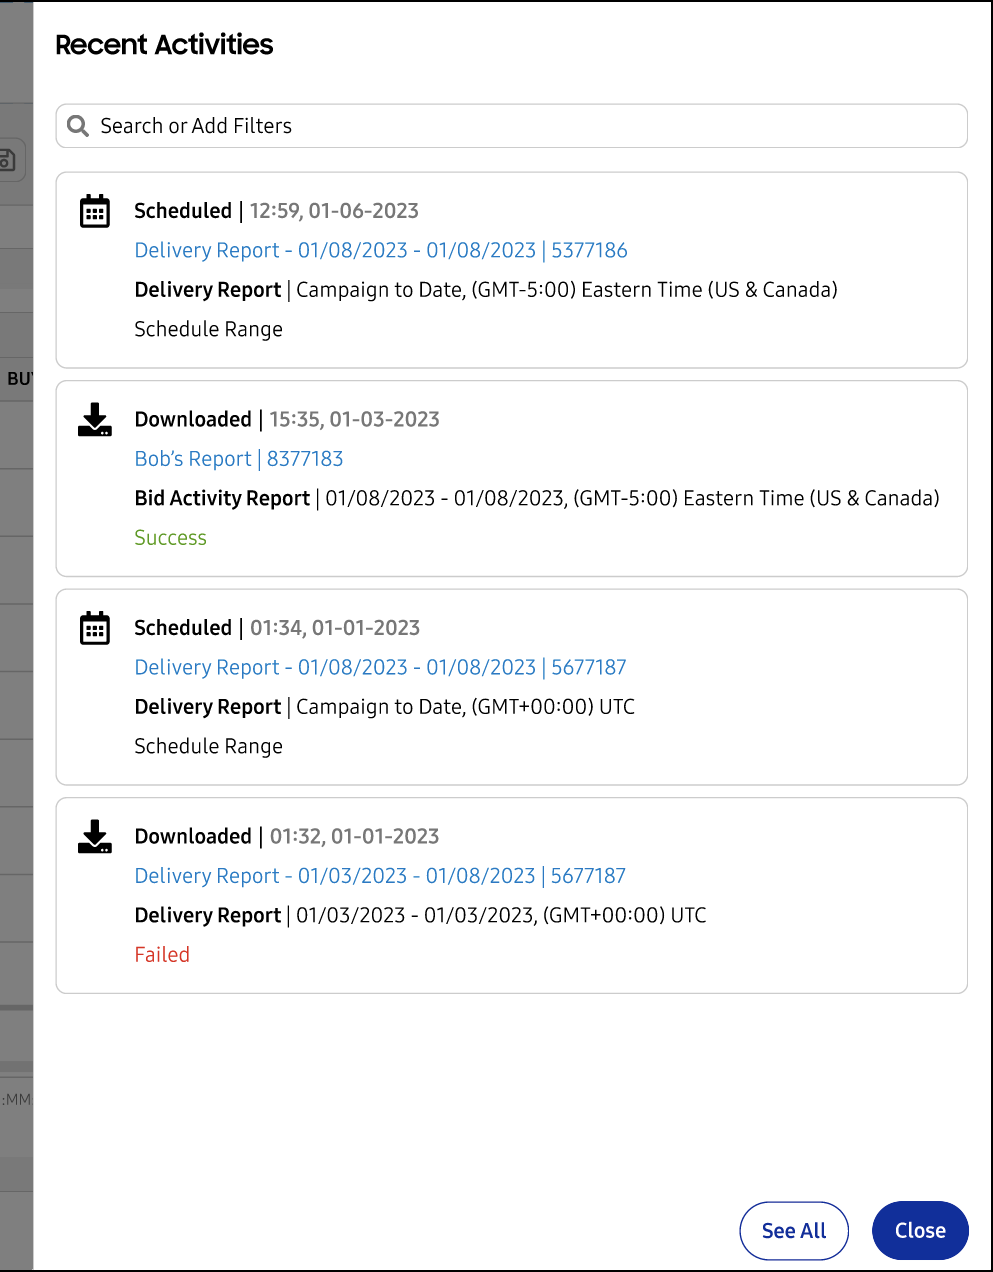
Adding in a Recent Activities drawer to keep track of downloaded and schduled delivery reports from the current login session.
Expanding the Trends chart by default.
Adding the ability to choose to download the report in a specific format.
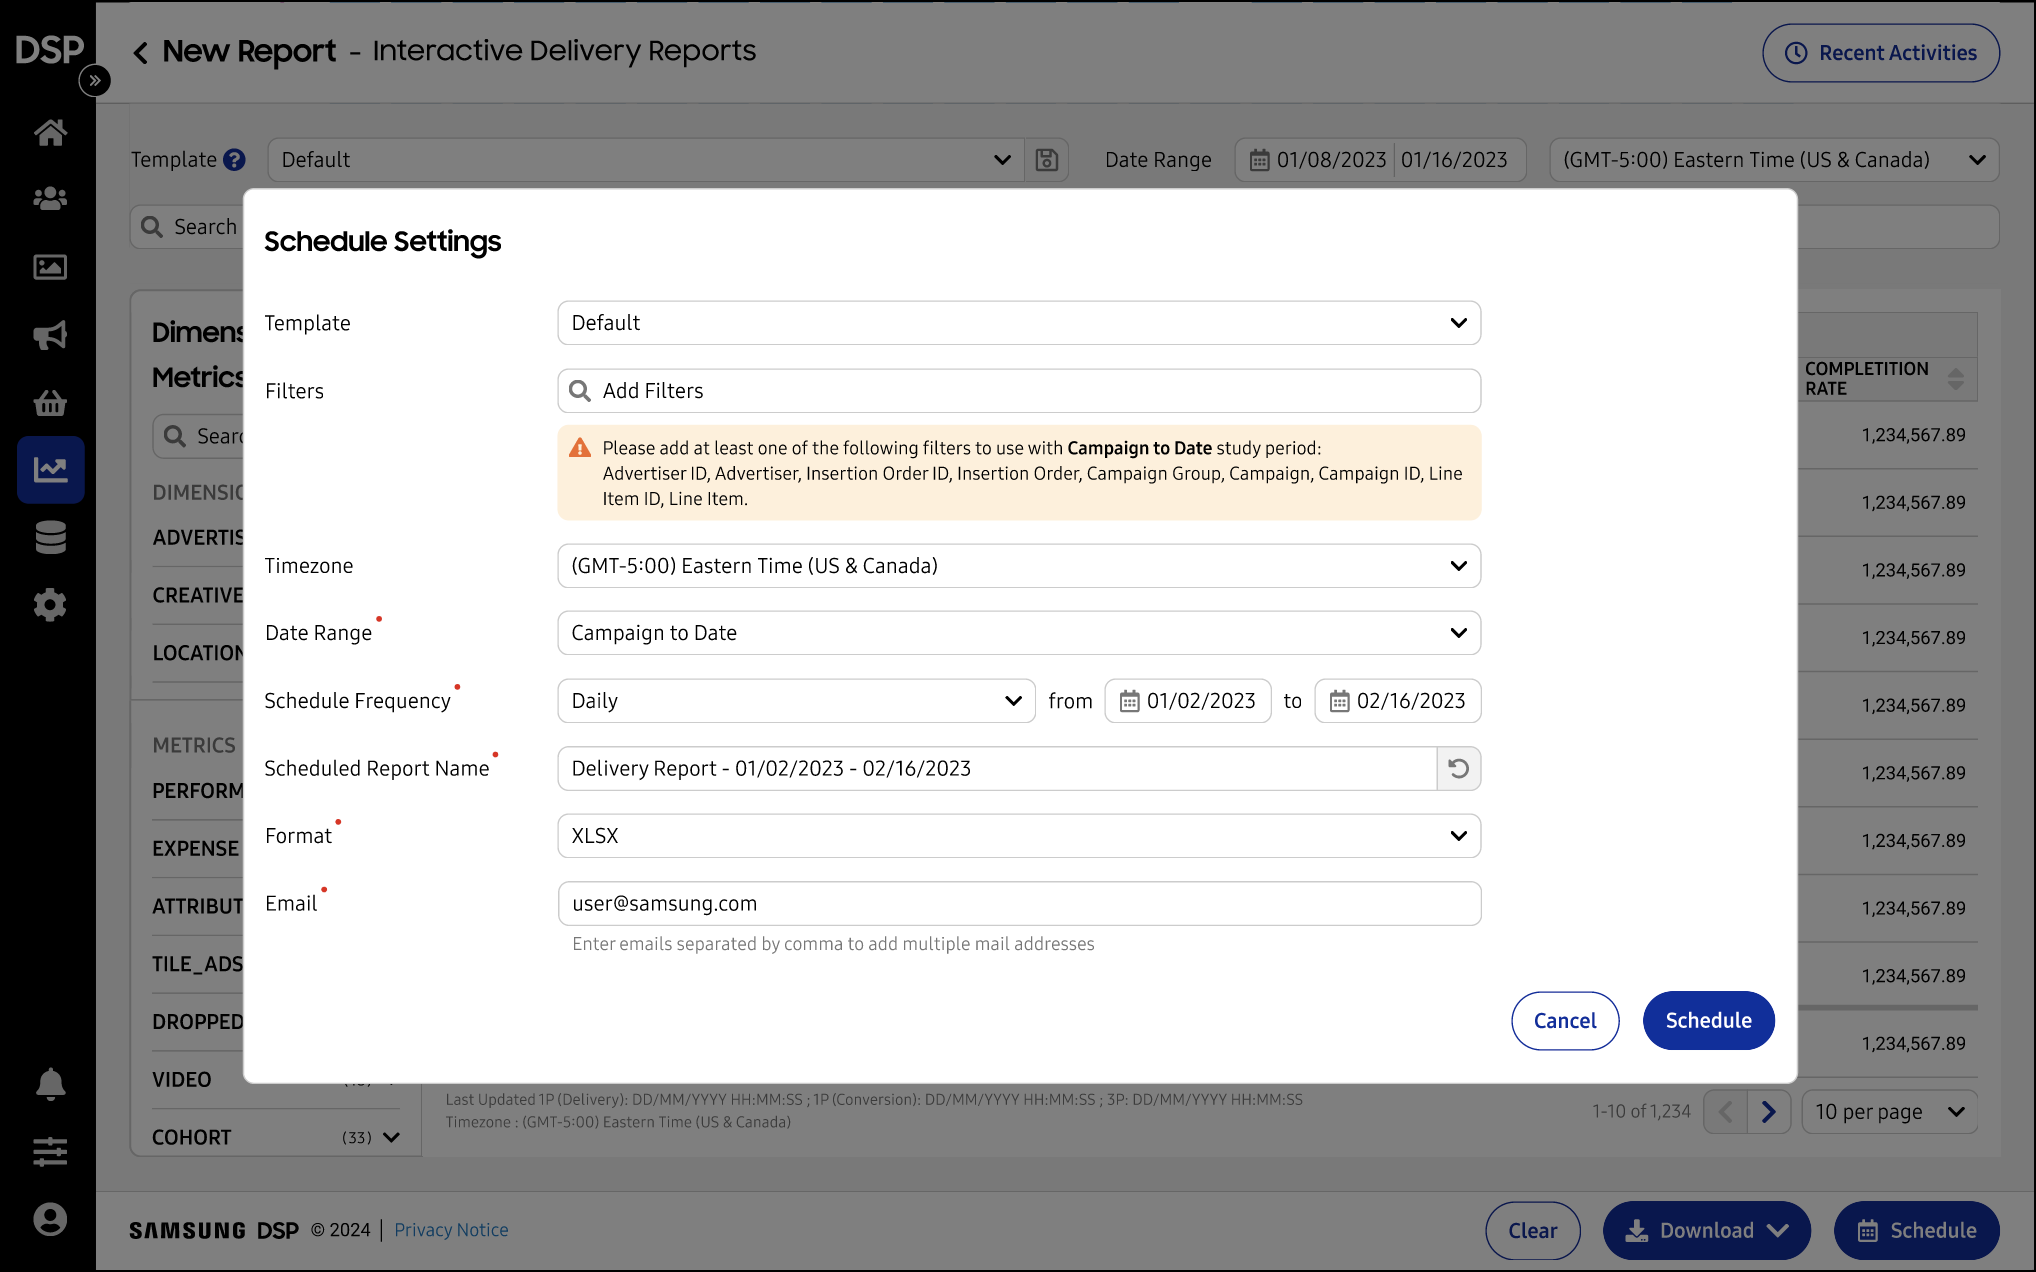
Add a pop-up in the Schedule flow to pick the scheduling settings.
Research Goal
Design and Product generated a list of questions focused on understanding whether this merging of the interactive and extract delivery reports made sense to users, and to validate the addition of the recent activities feature.
Our goal was to understand how users interacted with the new design and to identify areas of improvement.
Usability Test Questions
The participants were asked to answer questions about their experience in interacting with a prototype of the new interactive delivery report.
- Can users easily find the new report?
- How do users feel about the navigational change?
- Can users easily schedule a report?
- How do users feel about the schedule flow?
- Can users easily edit a report?
- How do users feel about the editing settings?
- Can users easily download a report?
- How do users feel about the download flow?
- How do users feel about the download formats?
Research Methodology
I conducted usability testing to better understand how real users would interact with the new design and to highlight key areas for improvement. I wanted to ensure that merging the interactive and extract delivery reports was intuitive for users, and their feedback was crucial in validating this redesign.
This study was completed in two weeks to provide timely feedback to the design team.
Planning: 5 days
Recruitment: 1 day
Usability Test: 3 days
Analysis: 4 days
Recruitment
We recruited six internal Samsung Ads employees across our global operations teams. Participants were recruited through our internal employee communication channels. The participants were chosen to represent a variety of internal roles, in order to explore the different role responsibilities and needs:
- 2 Campaign Managers
- 1 Supply Performance Manager
- 1 Business Intelligence Manager
- 2 Client Solutions Managers
All participants had experience scheduling and downloading delivery reports in the Samsung Ads DSP.
Usability Test Sessions
I conducted six remote moderated usability tests. The tests were conducted using a Figma prototype over Microsoft Teams. Sessions were conducted in 45-minute timeslots based on the availability of the participants. All sessions had a note-taker to transcribe participant actions and quotes into a Google Sheets document.
Each session began with an introduction to the study goal and warm-up questions. The majority of the session was spent going through the usability test questions with the participant. This was divided into three sections, where the participant was asked how they would do the following tasks using the Figma prototype:
- Schedule a report
- Edit a report
- Download a report
Results
Analysis and Synthesis Process
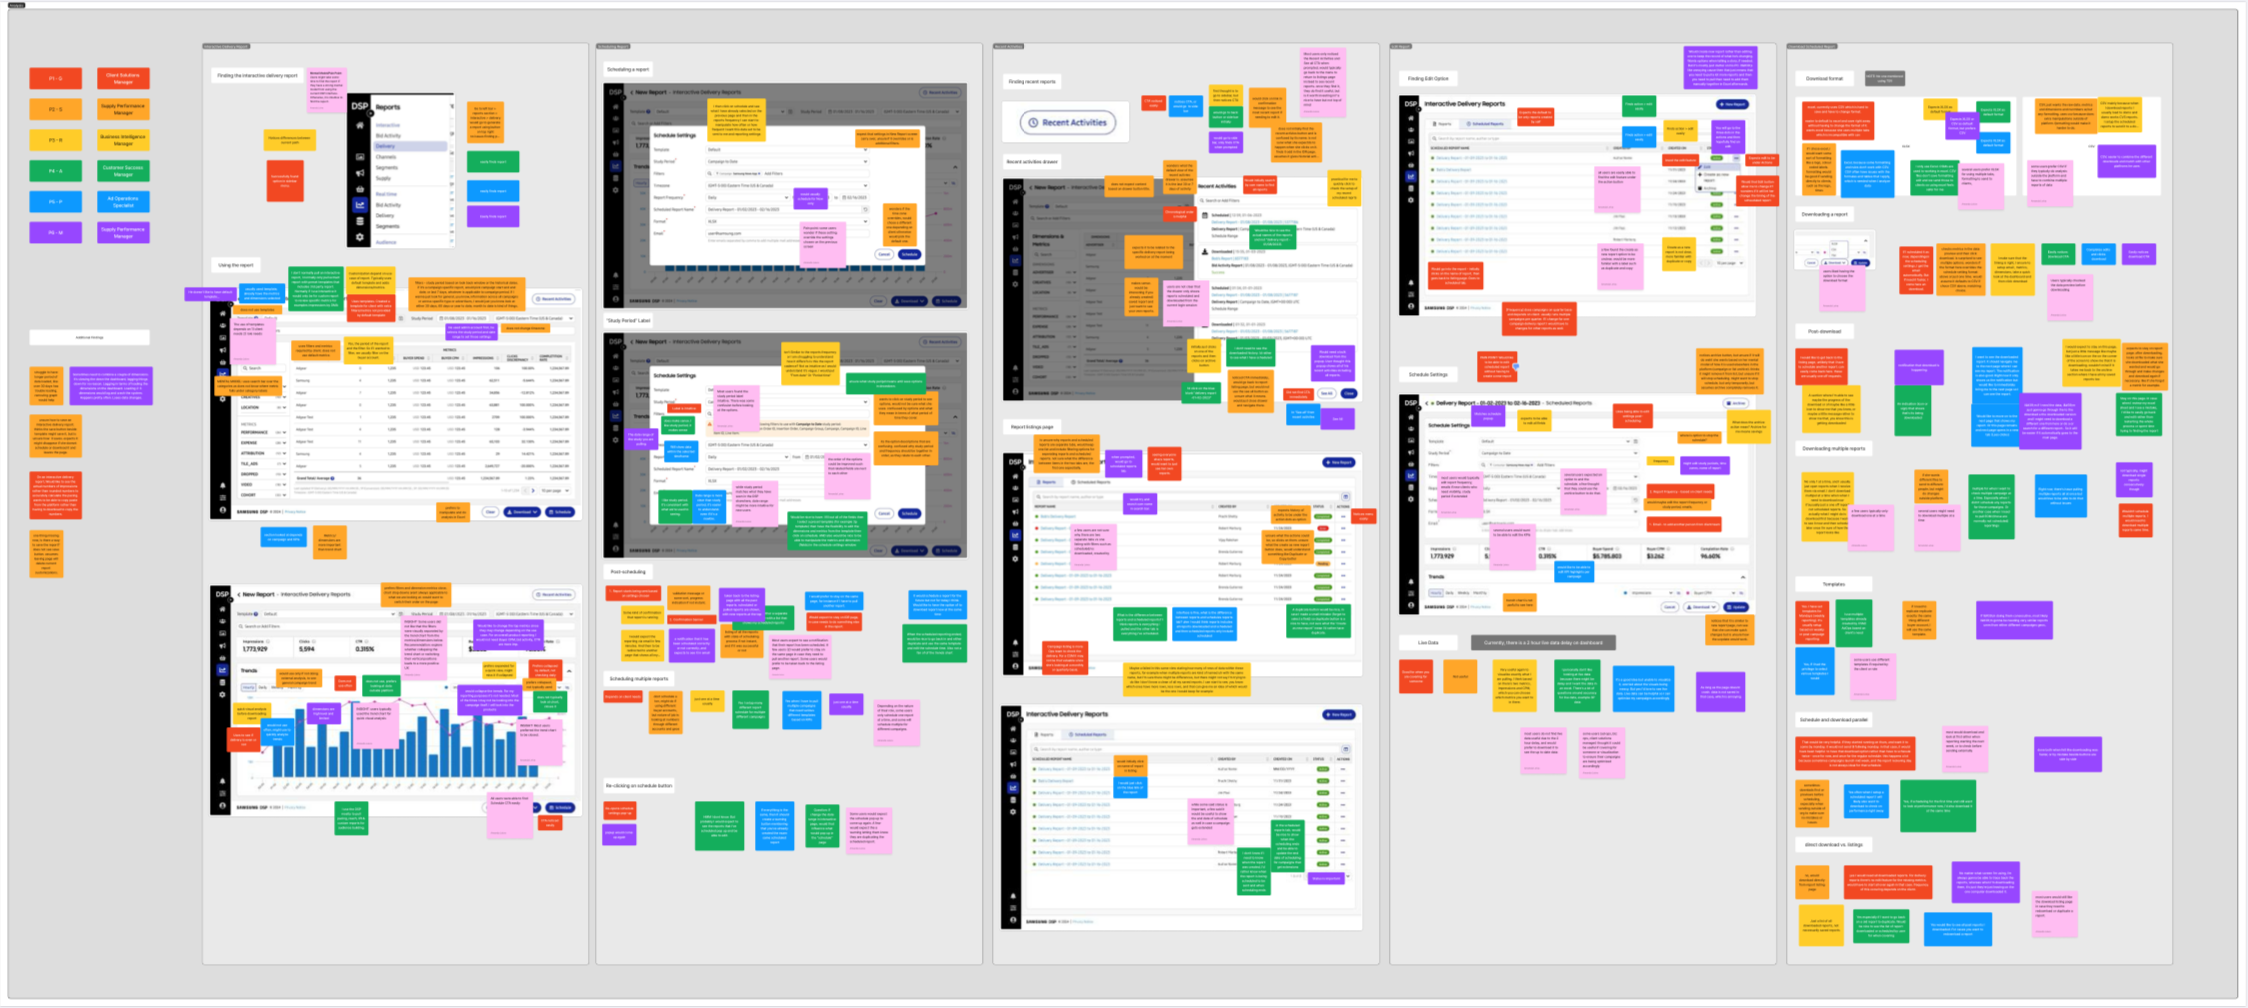
Debriefs with the UX Research team were conducted after each session to discuss key findings and insights. We conducted a thematic analysis of the usability test results in FigJam. Notes were added in context over screenshots of the prototype to aid the insight development process. Themes were generated from participant notes/quotes, and further developed into insights.
Key Insights
Based on the insights developed, In collaboration with other members of the UX Research team, I generated set of five key insights and actionable recommendations.
- The Recent Activities drawer does not bring any addiitonal value to users. Users would not think to use it to see their report listings.
- Users did not expect that the Recent Activities drawer showed all activity from the current login session.
- A few users thought the Recent Activities drawer would contain historical report activity.
- Most users preferred for the Trends chart to be collapsed by default as they typically only used it for quick visual analyis. Users did not like that it visually seperated the filters from the Dimensions & Metrics.
- Users liked the ability to download their scheduled reports and view their download history for quality control and visibility.
- Users need more visibility into their report scheduling details, such as when the schedule begins and ends.
- Users wanted to be able to preview their schedule settings and scheduled data before scheduling a report.
Key Recommendations
Insights were shared with the design team in a collaborative session to discuss the findings, recomendations, and prioritize design changes.
- Removing unnecessary information or interactions that do not add to the user experience.
- Ensuring that the new design was properly introduced to users to ensure minimal user confusion.
- Improving clarity and ordering of labels.
- Providing short-cuts for frequent actions.
- Providing transparency on when data was last updated.
- Providing the ability to view edit history.
During the study read-out with Product and Design, we discussed the best way in which these recommendations could be incorporated into the design to optimize for efficiency and user-friendly design.
Impact
I was able to provide valuable insights and recommendations on product design improvements of the Interactive Delivery Report. These recommendations were prioritized and incorporated as part of the broader product roadmap; demonstrating UX thought leadership of pro-actively improving the user experience and usability of our platforms.
Participants in this study viewed the design and feature changes as largely positive. Participants expected it would allow them to be more efficient in their future workflows when generating, scheduling, and downloading delivery reports for their clients.
We looped in Product Marketing to ensure that the design changes are communicated to Samsung Ads DSP users in a clear and user-friendly manner using contextual alerts and updated help documentation.
Reflections
I was involved from start to finish—helping plan the study, recruiting participants, creating the usability test script, and analyzing the results. It was a great opportunity to work closely with the Design, Product, and Research teams and ensure our goals were aligned throughout the study. I also had to insist on maintaining the quality of the prototypes and manage delays in their availability, which highlighted the importance of coordination between teams, especially under tight deadlines.
Conducting the usability tests and gathering feedback from users helped me uncover valuable insights into the design. I found that structuring the tests and documenting everything thoroughly made a big difference in understanding user pain points and crafting actionable recommendations.
One challenge I faced during this study was a delay in the availability of design prototypes for my research. Instead of resorting to confrontation, I focused on collaboration to communicate to the Design team that a high-quality prototype was essential for gathering useful and timely insights. I conveyed to Design that inconsistencies in the prototype could confuse participants during usability sessions. I emphasized to stakeholders that coordination between Design and Research on deliverable readiness, along with clarification with Product on expected questions and outcomes, is crucial when working under tight deadlines in future studies.
Looking forward, I would like to track how the changes play out in real-world use over time. Overall, this study reinforced my skills in UX research and underscored the importance of effective communication and collaboration.